About Course
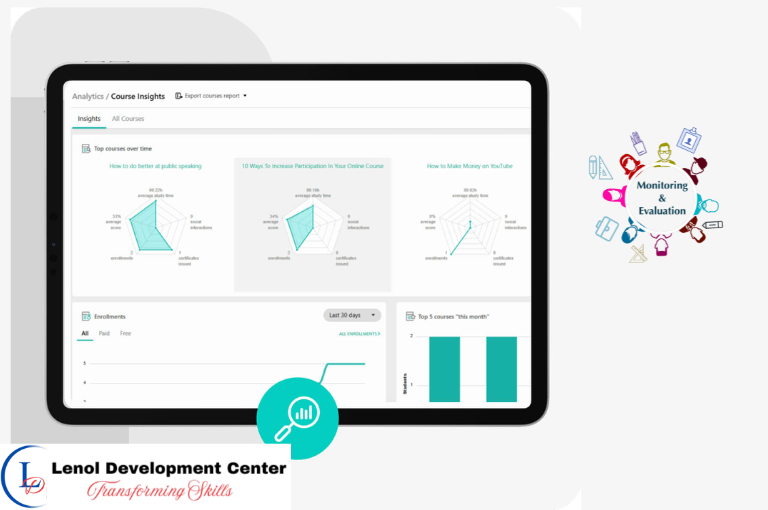
Enhancing Monitoring & Evaluation with Interactive Analytics and Reporting Training Course
Introduction
In the rapidly evolving landscape of development and humanitarian work, static reports are no longer sufficient to meet the demand for real-time, actionable insights. This Enhancing Monitoring & Evaluation with Interactive Analytics and Reporting Training Course is specifically designed for M&E practitioners, program managers, and data analysts who aspire to transform their reporting from passive documents into dynamic, engaging, and highly interactive tools. Participants will gain cutting-edge skills in leveraging interactive data visualization and dynamic reporting platforms to enable stakeholders to explore M&E data themselves, uncover hidden patterns, and facilitate more informed and collaborative decision-making.
This intensive program provides hands-on experience with industry-leading tools to create compelling interactive dashboards and reports that allow for deep dives into program performance, disaggregated data analysis, and immediate identification of trends and anomalies. Attendees will learn to prepare data for interactive environments, design intuitive user interfaces, and effectively communicate complex M&E findings through compelling visual narratives. By mastering interactive analytics for M&E, professionals will be empowered to foster greater transparency, enhance accountability, accelerate learning cycles, and drive adaptive management within their organizations.
Target Audience
- M&E Officers and Specialists
- Data Analysts and Visualizers
- Program and Project Managers
- Reporting and Communication Leads
- Evaluators and Researchers
- Decision-makers who review M&E data
- NGO and Government Staff
Duration
5 Days
Course Objectives
- Understand the principles and benefits of interactive analytics and dynamic reporting in M&E.
- Prepare and structure M&E data for effective interactive visualization.
- Utilize leading software tools to build interactive dashboards and reports.
- Design compelling interactive visualizations to communicate complex M&E findings.
- Implement filtering, slicing, and drill-down capabilities for deeper data exploration.
- Facilitate data-driven discussions and decision-making using interactive M&E reports.
- Ensure data security, privacy, and accessibility in interactive reporting environments.
- Develop strategies for maintaining and scaling interactive M&E reporting solutions.
Course Content
Course Content
Module 1: Introduction to Interactive Analytics in M&E
- Evolution from static reports to dynamic, interactive insights
- The power of interactivity for M&E stakeholders
- Key components of an interactive M&E report/dashboard
- Benefits: enhanced engagement, deeper insights, faster decision-making
- Overview of tools for interactive analytics and reporting
Module 2: Principles of Effective Interactive Reporting
- User experience (UX) and user interface (UI) design for M&E dashboards
- Information hierarchy and layout best practices
- Guiding users through interactive data exploration
- Balancing simplicity with depth in interactive reports
- Designing for different audience needs and technical literacy levels
Module 3: Data Preparation for Interactive Analysis
- Data structuring: long vs. wide format for interactive tools
- Data cleaning and validation techniques for M&E datasets
- Data transformation: aggregation, pivoting, merging datasets
- Creating calculated fields and measures for interactive analysis
- Ensuring data integrity and accuracy for dynamic reports
Module 4: Core Interactive Analytics Tools (e.g., Excel Power Tools, Google Sheets)
- Leveraging Excel's Power Query for data import and transformation
- Using Excel's Power Pivot for data modeling and relationships
- Creating interactive charts and pivot tables in Excel
- Introduction to Google Sheets for collaborative and basic interactive reporting
- Best practices for preparing data in spreadsheets for interactive dashboards
Module 5: Building Interactive Dashboards for M&E (Power BI/Tableau)
- Introduction to leading Business Intelligence (BI) tools (e.g., Microsoft Power BI Desktop, Tableau Public)
- Connecting to various M&E data sources
- Designing compelling interactive dashboards from scratch
- Creating relationships between tables for cross-filtering
- Publishing and sharing dashboards (basic concepts)
Module 6: Advanced Interactive Visualizations
- Utilizing advanced chart types for M&E data (e.g., treemaps, sunburst, bubble charts)
- Implementing custom visual elements and themes
- Creating small multiples and dynamic comparisons
- Techniques for showing change over time interactively
- Best practices for color usage and typography in interactive visuals
Module 7: Implementing Filters, Slicers, and Drill-Downs
- Designing effective filters for M&E dashboards (e.g., by program, location, time)
- Creating interactive slicers for quick data subsetting
- Implementing drill-through and drill-down functionalities for granular insights
- Designing interactive maps with spatial filtering capabilities
- Guiding users through data exploration pathways
Module 8: Storytelling with Interactive Data
- Structuring interactive reports to tell a compelling M&E story
- Using annotations and narratives within dashboards
- Highlighting key findings and calls to action dynamically
- Creating "guided tours" or narrative flows within dashboards
- Balancing free exploration with curated insights
Module 9: Collaborative Features and Sharing Interactive Reports
- Publishing and sharing interactive M&E dashboards securely
- Collaborative features of online BI platforms (e.g., comments, sharing workspaces)
- Embedding interactive reports into websites or M&E portals
- Managing access permissions for different user groups
- Strategies for promoting dashboard adoption and use
Module 10: Ensuring Data Security and Access in Interactive Platforms
- Implementing row-level security (RLS) for sensitive M&E data
- Best practices for secure data connections and credentials
- Understanding data residency and compliance in cloud-based platforms
- Auditing user activity and data access
- Developing internal policies for interactive M&E reporting
Module 11: Facilitating Data-Driven Discussions with Interactive Reports
- Preparing for and leading meetings using interactive dashboards
- Encouraging active data exploration and questioning from stakeholders
- Using interactive reports to identify areas for adaptive management
- Documenting decisions and actions derived from interactive data sessions
- Overcoming resistance to data-driven decision-making
Module 12: Maintaining and Updating Interactive M&E Reports
- Strategies for automating data refreshes and updates
- Version control for interactive dashboards and underlying data models
- Monitoring dashboard performance and user engagement
- Troubleshooting common issues in interactive reporting environments
- Planning for long-term sustainability and scalability of interactive M&E solutions
General remarks
General remarks
- Customizable courses are available to address the specific needs of your organization.
- The participant must be conversant in English
- Participants who successfully complete this course will receive a certificate of completion from Lenol Development Center.
- The course fee for onsite training includes facilitation training materials, tea break and lunch.
- Accommodation and airport pick up are made upon request
- For any inquiries reach us through info@lenoldevelopmentcenter.com or +254 710 314 746
- Payment should be made to our bank